
Neuron Visualizer — Ionic Currents on a Membrane
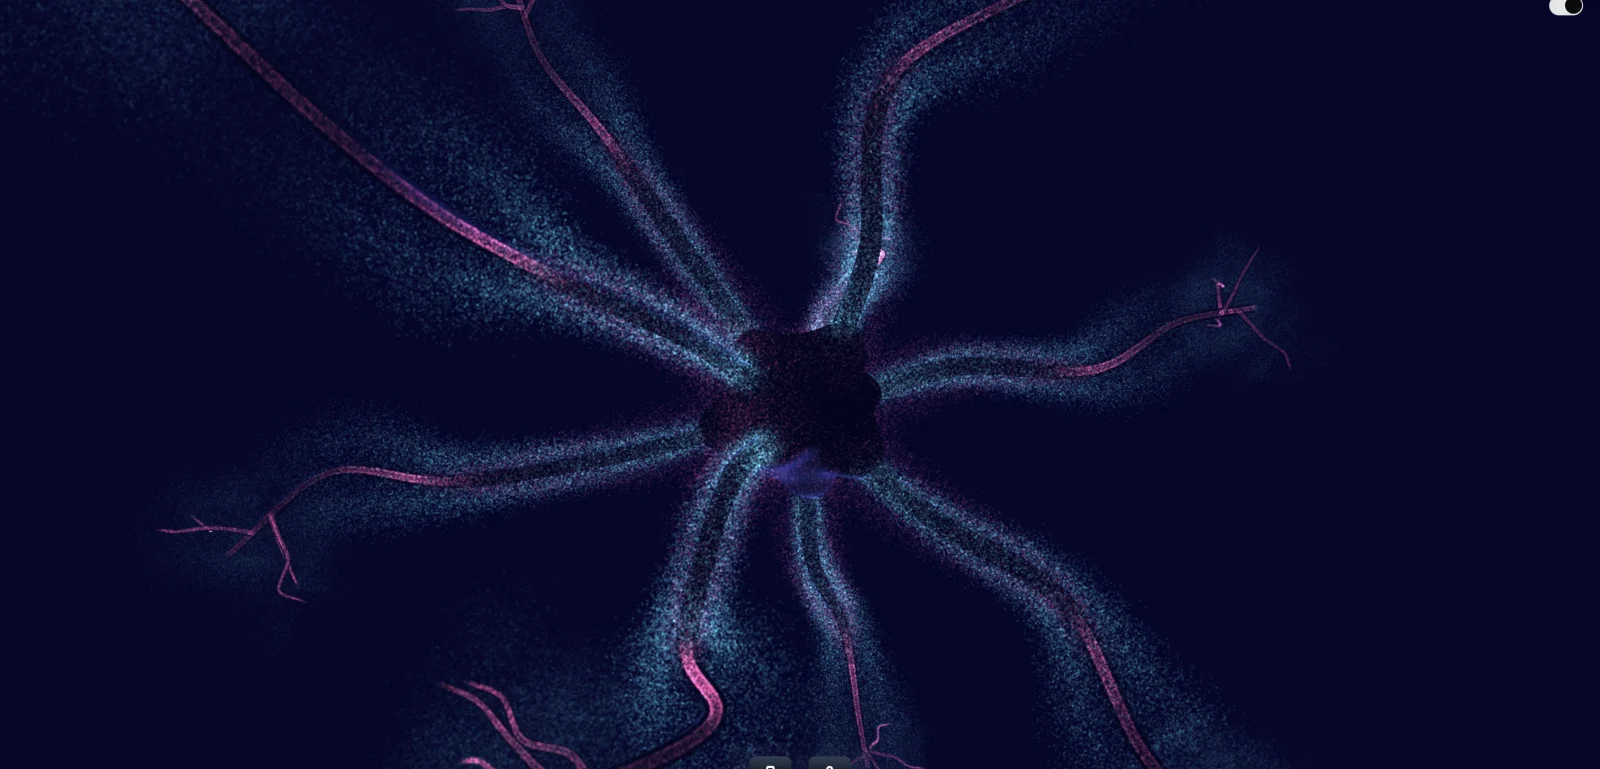
In college I spent a lot of time modeling neurons. Bio-electric signals in our body propagate along neurons. On a miniature scale, this occurs because tiny charged particles (ions) rush across cell membranes. In this way, signals propagate like a “wave” in a stadium crowd. In the past I studied these action potentials, ion channels, and the equations that relate membrane voltage to ionic currents. Years later I wanted to return to those ideas w/ the tangible visual that’s in my head – where ions flow across cell membranes.
Open the live neuron visualizer · source
It lives inside a past project r3f-audio-visualizer as a dedicated NEURON mode: a procedurally modeled neuron, GPU particle effects for Na⁺ influx and K⁺ efflux, and a traveling depolarization wave along the axons.
The college thread
These older posts are the historical spine this visual is circling back to:
- Modeling Neurons & Action Potentials — CRRSS propagation, cardiac APs, Hodgkin–Huxley with ODE45, dynamical-systems takes
- Modeling Ion Channels — how channel kinetics produce the currents that drive membrane voltage
- Voltage Clamp — holding membrane voltage fixed to isolate current
- Compound Action Potentials in Frog Sciatic Nerve — the wet-lab counterpart to the models
- Simulating Electrical Stimulation with COMSOL — extracellular fields and recruitment
The goal this time was to visualize the membrane activity as 3D art driven by the simulated ionic currents.
From equations to particles
The first explorations weren’t very visual. A Hodgkin–Huxley compartment stepped in time; a ring buffer of Vm, INa, IK, and leak was drawn as scrolling charts — the same four traces you stare at in a quantitative physiology notebook, rebuilt for realtime in a web browser.
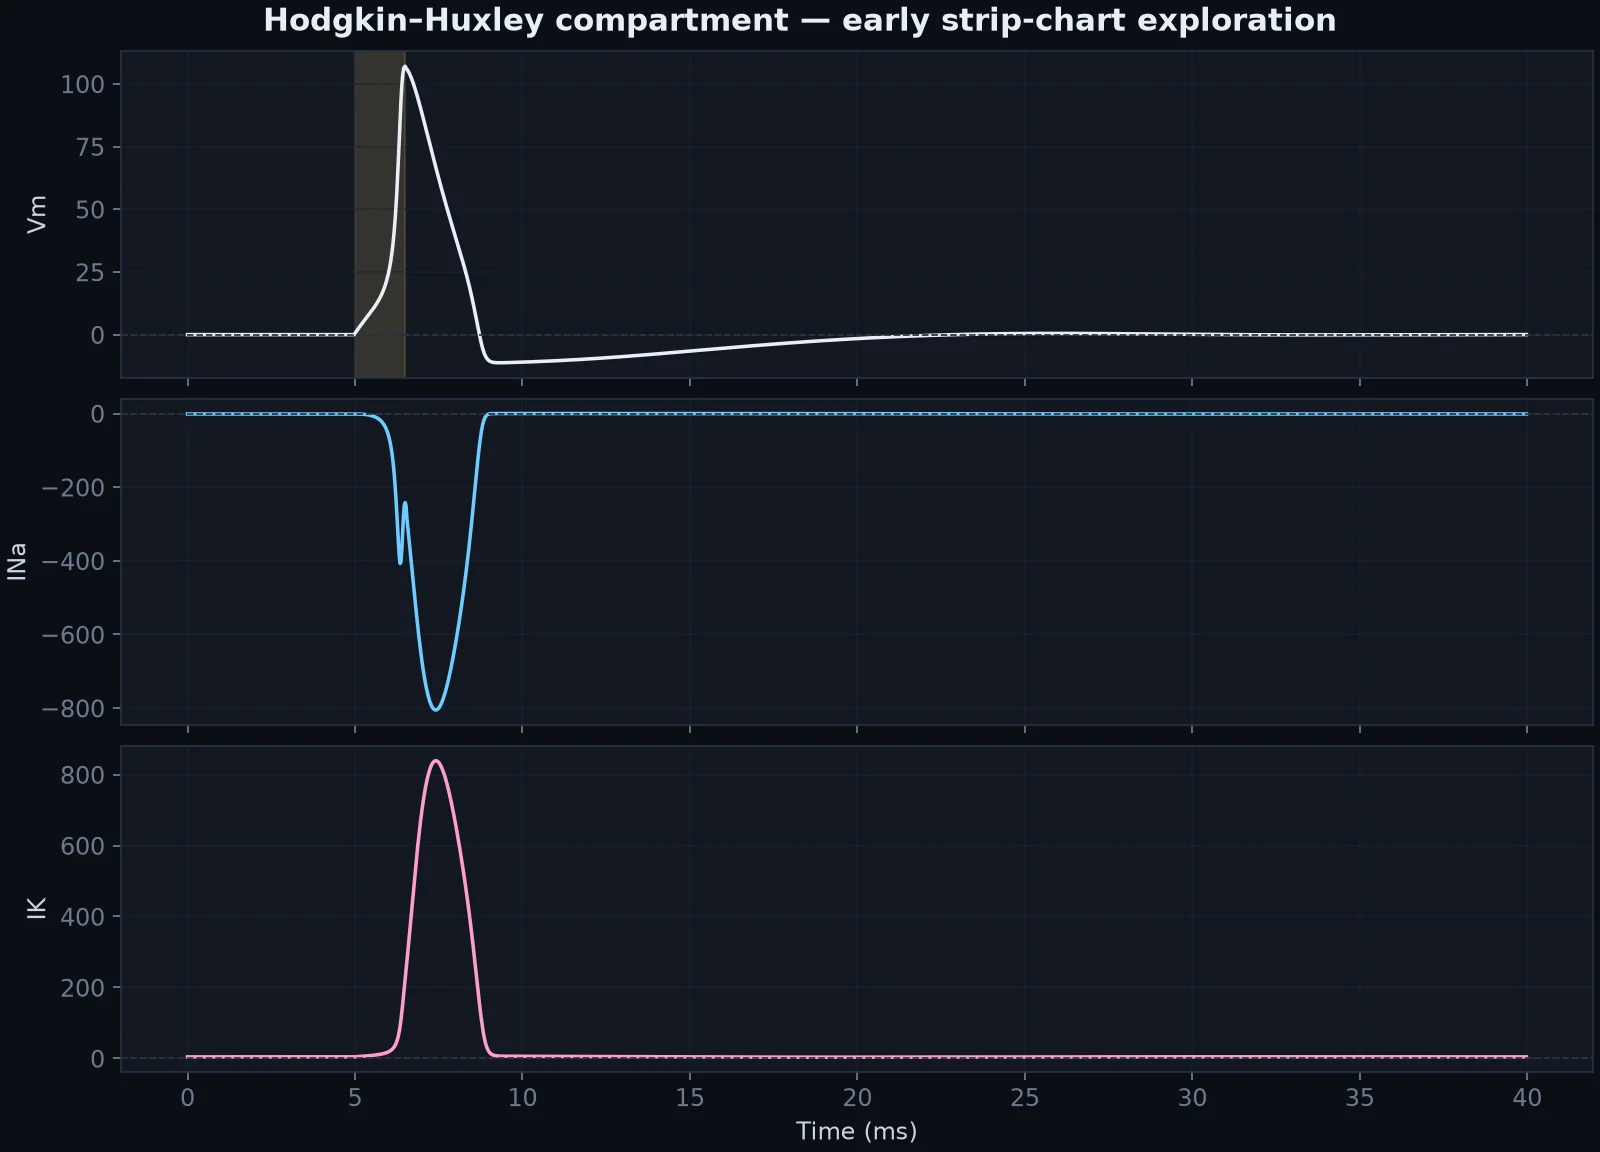
That HH model is still in the codebase. For the visualizer itself, a phenomenological action-potential shape ended up being the better driver: an α-kernel Na⁺ pulse, a delayed K⁺ pulse, and a difference-of-exponentials Vm bump, stretched along the axon so conduction delay stays readable. The particle system samples that waveform along each dendrite/axon segment and turns nonnegative “influx” / “efflux” drives into directional movement of particles (cyan and pink) along the axon.
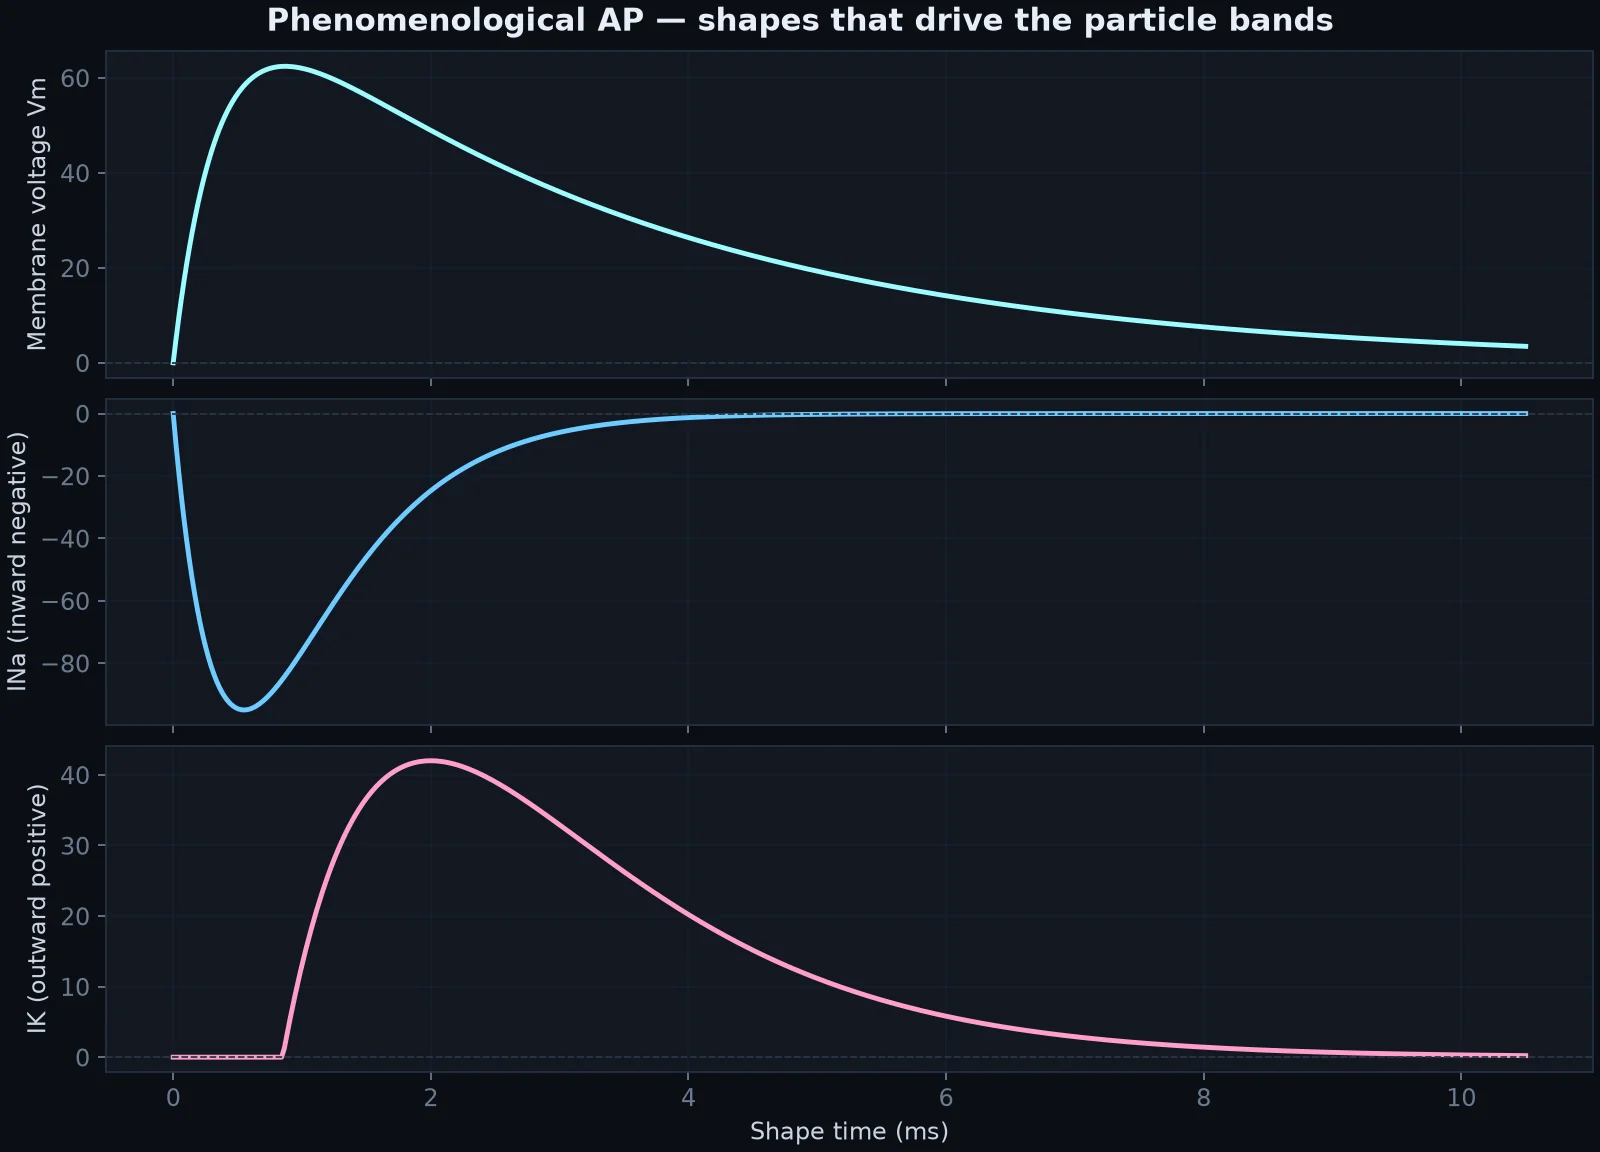
So the euqations were modeled to yield the timings, then sampled to drives hundreds of thousands of GPU particles on a branching neuron.
Some more details
- Geometry — a seeded procedural soma + branches (tubular segments with falloff), not a scanned mesh
- Cyan particles — Na⁺ influx drive, leading the depolarization band
- Pink particles — K⁺ efflux, lagging slightly so repolarization reads as a second sleeve of flow
- Controls — propagation speed, spike spacing, efflux separation, and particle count / intensity
This was a very fun return to college notebooks
Comments